Setting-up a study
EmPower assesses the potential success of the stimulus, so you can learn how to drive business growth, build your brand and encourage consumer engagement.
Key Measures
- Measure emotional reactions and audience attention.
- Analyze Emotional valence and engagement.
- Track consumers’ second-by-second emotional responses to the stimulus.
- Collect cognitive responses through a smart survey.
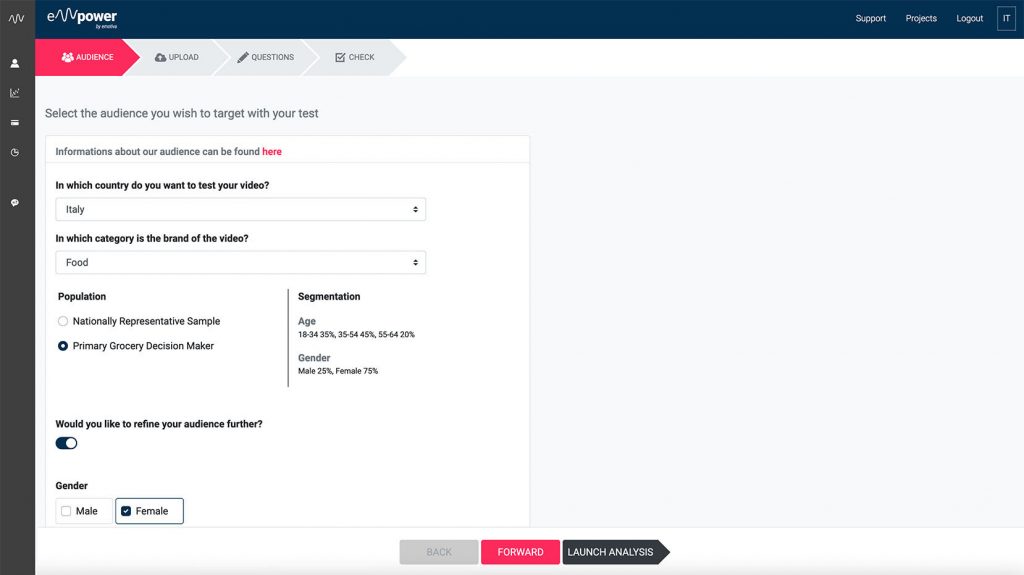
EmPower Configuration Checklist:
- Audience: Select Country and Audience (list of available Country can be found on the section “Audience”)
- Stimulus: Accepted formats are: .MP4 or .MOV (smaller than 50MB and with a recommended resolution of 1280×720)
- Survey: Understand if key messages are being understood correctly with a quick survey
- Maximum of 5 question (single-choice, multichoice, scale)
- To properly structuring a question every key message should be a full statement. For example, “The X brand is the number one brand in the category”.
Key metrics definitions
- Emotions. EmPower technology, based on Emotiva state-of-the-art emotion recognition algorithm, analyze emotions detecting AUs (Action Units) based on Paul Ekman F.A.C.S. system. EmPower presents the six basic emotions: happiness, sadness, surprise, anger, disgust and fear on a chart.
- Emotional ranking. n this section you can see the classification of your videos on the basis of the emotional impact generated on your audience.
- Global performance. This metric indicates the overall value of the content’s performance. The result obtained is derived from the metrics below. The output value is about three levels: LOW (1-4), AVERAGE (5-6), HIGH (7-10).
- Content effectiveness. It represents the effectiveness of the content in soliciting emotions and attention on the target. The value is a mix of an emotional-behavioural result generated by the audience regarding the content.
- Attention. This KPI represents behaviour and not an emotional state. The value expressed is an average of the audience’s attention to the content over its entire duration.
- Engagement. It represents the emotions’ activation intensity felt while watching the content.
- Predictive click. It determines, with a percentage of probability, if the content will generate clicks once published on social networks. It is a predictive KPI calculated on the content’s performance with organic traffic.
- Media optimization. It clearly and unambiguously represents on which target segmentation a better emotional response is generated.